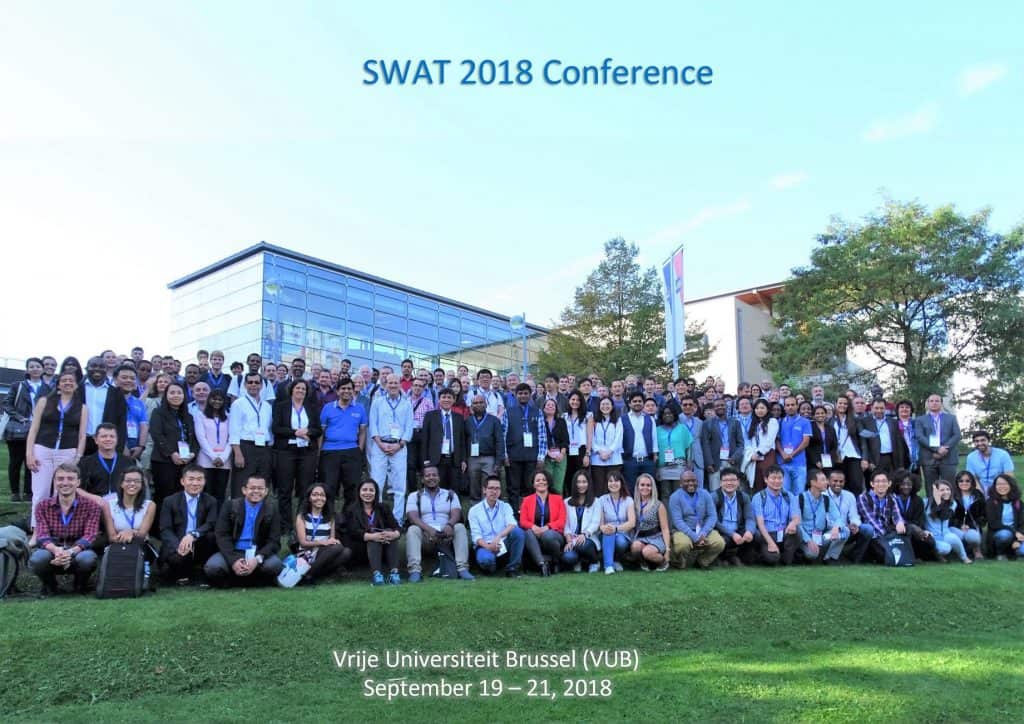
Jari Koskiaho and Mikolaj Piniewski presented the SWAT (Soil and Water Assessment Tool) setup of BONUS RETURN’s Vantaanjoki case study at the International SWAT conference held 19 – 21 September, 2018 in Brussels, Belgium.

SWAT nutrient calibration and validation with a 6-year dataset of continuos data in a Finnish catchment
ABSTRACT
One of the important limitations of numerous applications of water quality models such as SWAT is calibration and validation against temporally scarce observational data (with typical monthly grab sampling frequency). In this study, carried out within the BONUS RETURN project, a unique dataset of continuous measurements of water height, turbidity and nitrate-nitrogen (NO -N) concentrations collected at the Pitkäkoski automatic monitoring station in the Vantaanjoki river basin in southern Finland during 2011–2016 was utilized in calibration and validation of the SWAT model. The catchment is characterized by a high fraction of clayey soils, and in consequence, flashy runoff, with very large and short flood episodes with high nutrient concentrations. Data was recorded at 1-h intervals with a s::can nitro::lyser (www.s-can.at/products/spectrometer-probes#) sensor.
Sensor-measured turbidity (raw data) was calibrated against simultaneous water-sampled turbidity and converted to total phosphorus (TP) concentrations by linear regression equations derived from water sampled turbidity and TP. For the sake of calibration and validation in SWAT-CUP Sufi-2 programme, concentration and flow data were aggregated into daily loads of NO -N and TP. Preliminary results show good model calibration results, with the Kling-Gupta Efficiency values above 0.8 for flow and above 0.7 for NO -N and TP. In the next step, the added value of using such a unique, continuous data set for SWAT calibration will be more formally analysed by creating ‘calibration scenarios’ using discrete sub-samples of the continuous data set trying to mimic most typical grab sampling approaches (measurements with a monthly interval, flow-weighted sampling, etc.).
Keywords
automatic monitoring station, continuous data, sampling frequency
Authors:
1. Finnish Environment Institute: Jari Koskiaho, Sirkka Tattari.
2. Warsaw University of Life Sciences: Mikołaj Piniewski, Paweł Marcinkowski.
Jari Koskiaho – Research Engineer, BONUS RETURN
Mikolaj Piniewski – Hydrology and water resources expert, BONUS RETURN


